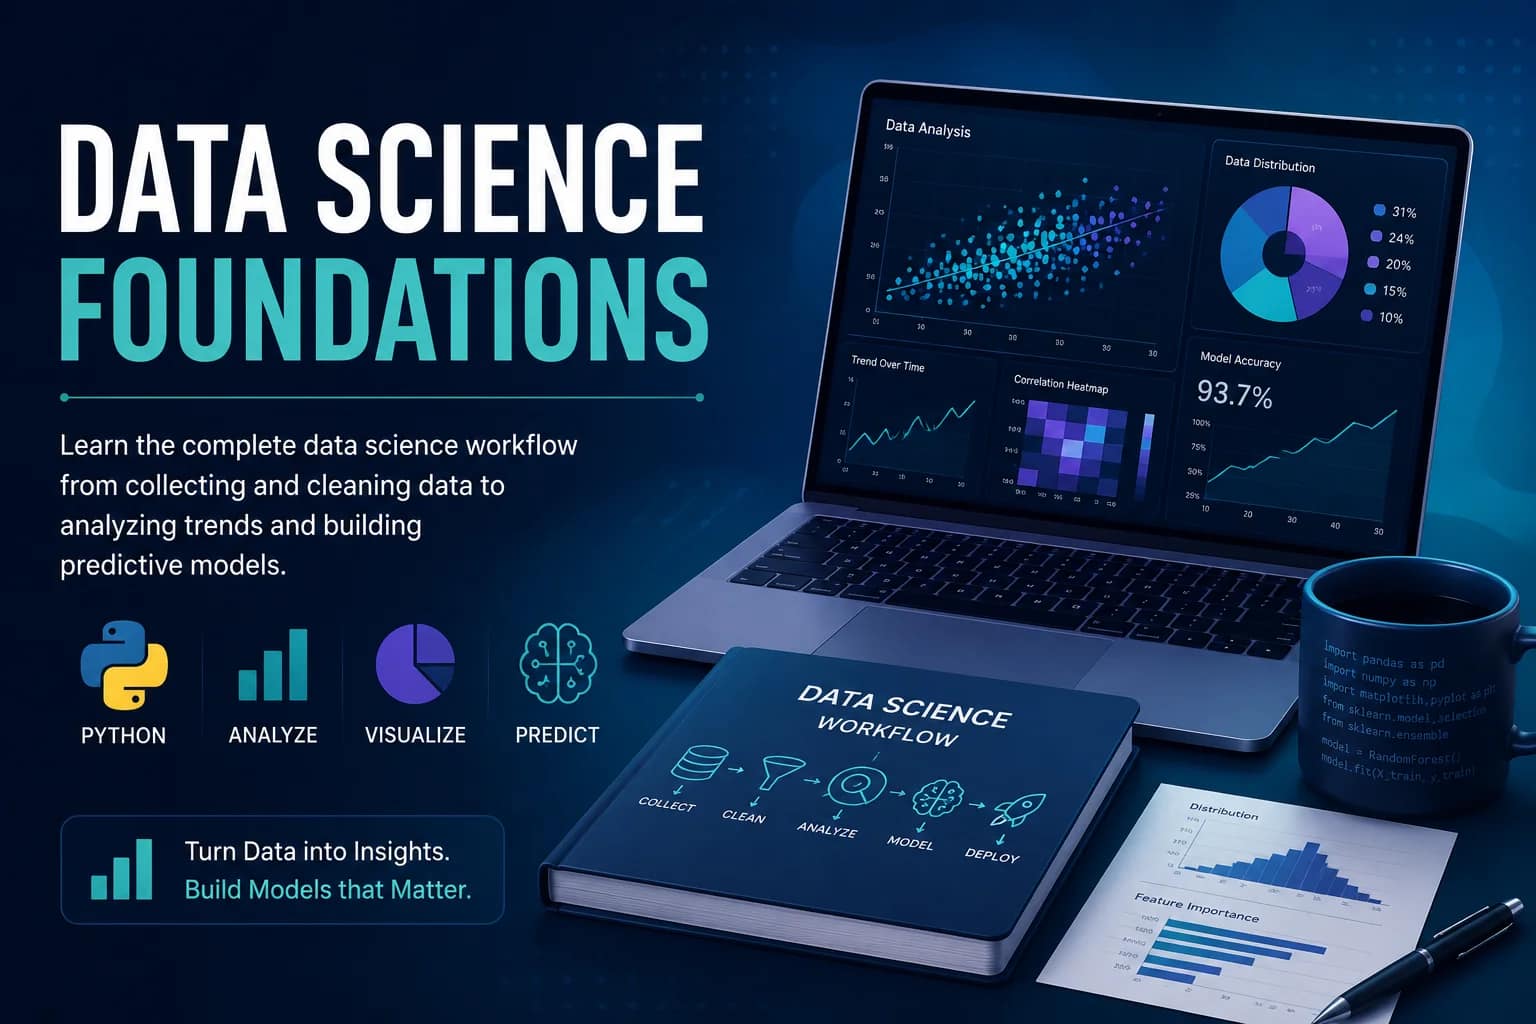
Data Science Foundations is a masterclass designed to take you from foundational concepts to building functional computational models and analytical workflows. Modern data environments demand more than raw technical knowledge—they require a cohesive blend of statistical rigor, programming proficiency, and business context. This course provides a complete toolkit to extract high-value insights, clean complex datasets, build data visualisations, and deploy predictive models using industry-standard open-source ecosystems.
Core Learning Pillars
-
Statistical Foundations & Probability: Master descriptive statistics, inferential hypothesis testing, distribution profiles, and baseline probabilistic reasoning.
-
Core Computational Tools: Gain proficiency in Python programming, focusing on core data structures, modular function development, and exception safety.
-
Data Manipulation & Feature Engineering: Clean raw, unstructured input files using Pandas and NumPy, handling missing data, standardising data types, and filtering anomalies.
-
Exploratory Data Analysis (EDA) & Storytelling: Build interactive visualisations using Matplotlib and Seaborn to communicate trends and insights to stakeholders.
-
Predictive Analytics & Machine Learning: Understand fundamental supervised and unsupervised algorithm mechanics—including Linear Regression, Decision Trees, and Clustering—using Scikit-Learn.
Comprehensive Curriculum Overview
Module 1: Mathematical Foundations & Python Setup
-
Setting up local development environments using Anaconda, VS Code, and Jupyter Notebooks.
-
Basic statistics: Mean, median, mode, variance, standard deviation, and standard distributions.
-
Core Python constructs: Dynamic typing, control structures, custom functions, and exception handling.
Module 2: Data Wrangling with Pandas & NumPy
-
Vectorised matrix operations, indexing arrays, and slicing dynamic dimensions in NumPy.
-
Tabular data structures: Loading, merging, grouping, and transforming Pandas DataFrames.
-
Dataset auditing: Identifying structural outliers, cleaning missing null values, and parsing date formatting.
Module 3: Exploratory Analysis & Graphical Storytelling
-
Designing clear visual representations: Line charts, heatmaps, distribution plots, and bar graphs.
-
Cross-tabulation, multi-axis plotting, and custom theme styling with Seaborn and Matplotlib.
-
Translating technical output into actionable strategic recommendations.
Module 4: Machine Learning Pipelines & Deployment Basics
-
Data preprocessing: Feature scaling, standardisation, and train-test split validation strategy.
-
Supervised model implementations: Regression, Classification, and evaluating evaluation metrics (RMSE, Precision, Recall).
-
Unsupervised methods: -Means clustering for audience segmentation and pattern discovery.
Targeted Audience & Prerequisites
-
Aspiring Data Scientists & Analysts: Beginners looking to establish structured computational skills in data analytics.
-
Software Engineers & Developers: Technologists expanding their expertise into machine learning frameworks and statistical computing.
-
Business & Strategy Professionals: Analysts looking to automate manual Excel workflows with scalable Python code.


Reviews
There are no reviews yet.